Graphite Sample Point Plots

Spiral With Shadows
The image here is a parametric line plot sampled at 500 points, illustrating a
simple spiral. In addition to the main dataset (in red), two additional copies
were attached with the Y set to zero (purple) or the X set to -1 (green),
creating "shadows" of the illustrated 3D curve.
April 20, 1999

Point Plot with Symbols
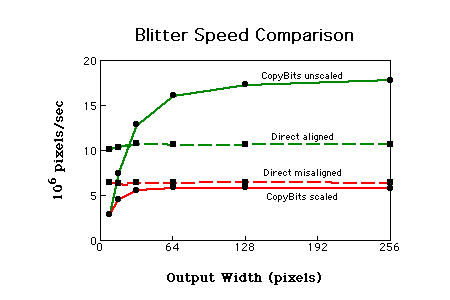
This sample plot shows the use of symbols. Currently circle and
square symbols
are implemented. Notice also the overlays
labeling each line.
June 20, 1999

Point Plot with two Y axes
This graph shows two Y axes with different ranges. It also exibits
dashed lines and string formatting which allows for the greek
letter.
June 20, 1999

Manual coded legend
An example of a legend. In release 0.1 a legend must be constructed
with overlays.
June 20, 1999

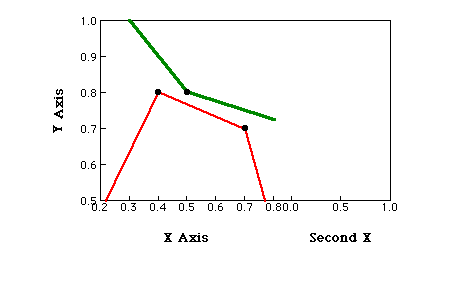
Two different X axes
It is possible to define multiple axes and each dataset
specifies which axes they will be plotted on.
June 20, 1999
http://Graphite.sourceforge.net/samplepoint.html
Last Updated:
1/10/00. . . . . .mstrout@cs.ucsd.edu


